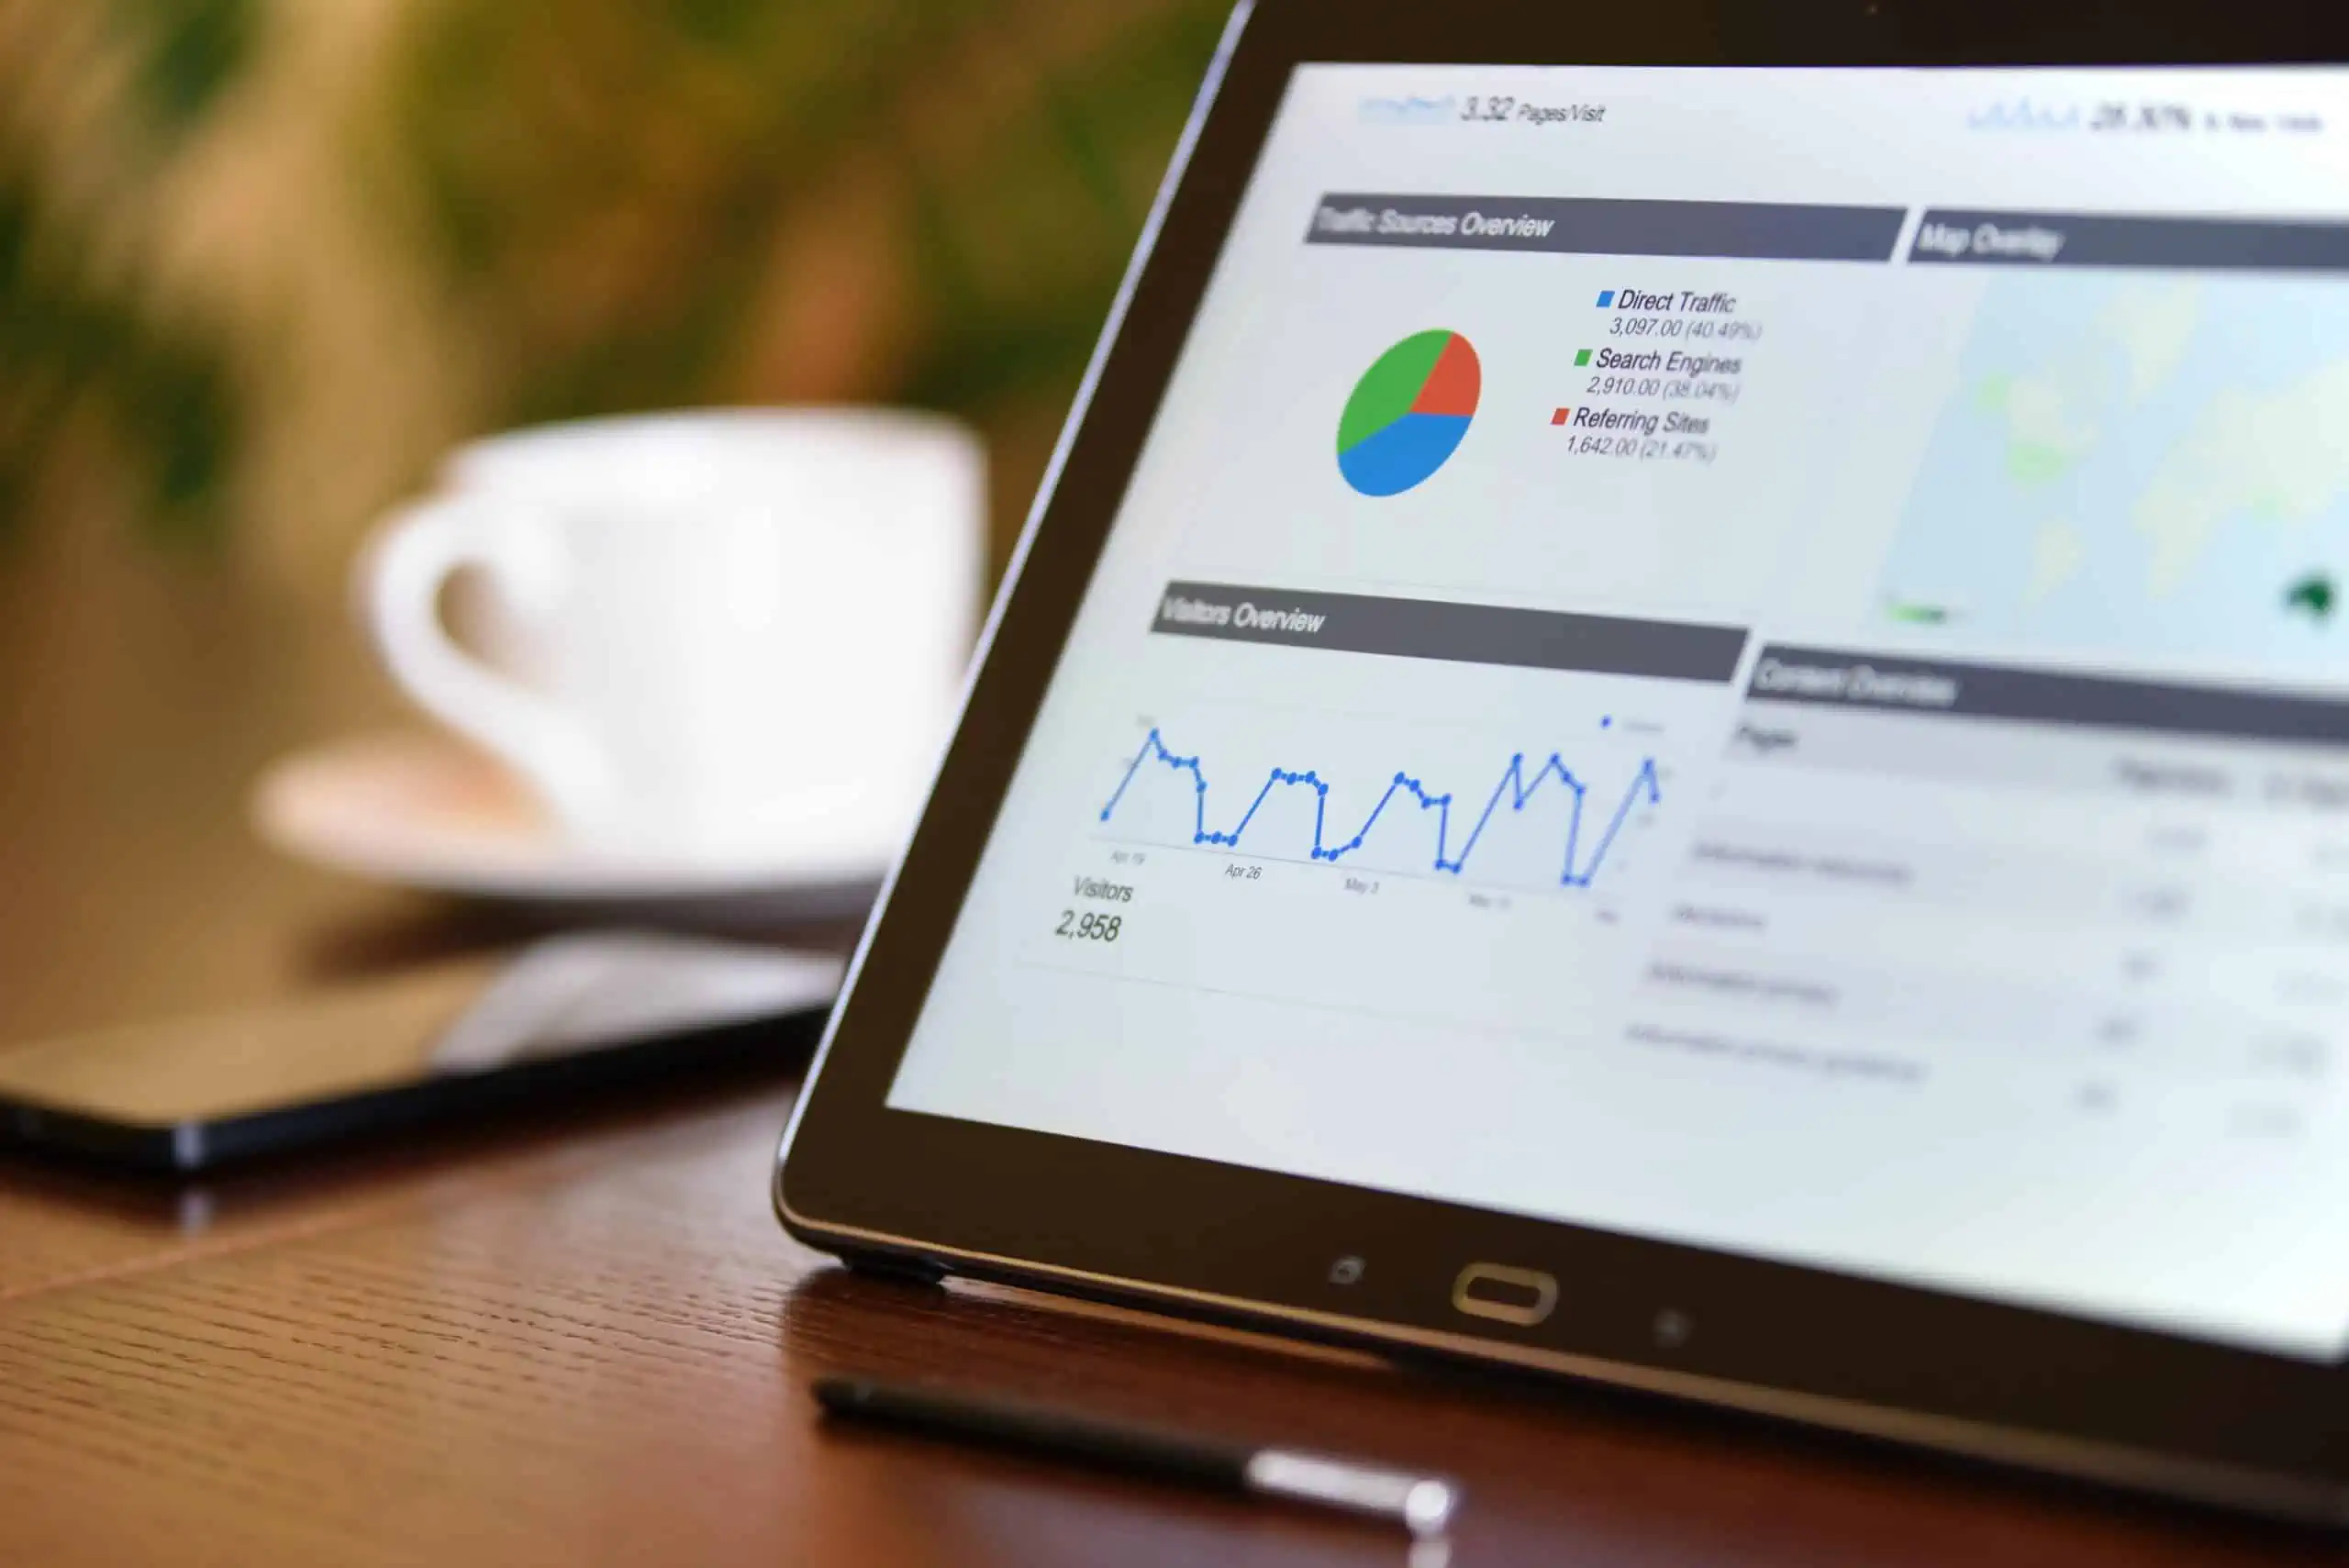
There is little doubt that Google Analytics is an absolute treasure trove of information and insight – and the data it provides can make a serious difference to your marketing efforts and results when incorporated into your decision making and campaign planning.
That said, we also know that it can be incredibly overwhelming thanks to the sheer amount of dashboards, data and reports open to you when you first sign on. The fact that you have so much to navigate can be off-putting but it would be a mistake to right off Google Analytics as being too complicated.
To help you get more out of this free tool and use some of the insight that it offers, here’s our quick rundown of the three most useful reports to get you started on your journey into data-led decision making.
Acquisition > All Traffic > Source / Medium
This report will tell you exactly how visitors are landing on your site. When accessing this report from your Google Analytics dashboard, you’ll be presented with a list (sorted by default from largest source to smallest) which tells you where your traffic originated from to arrive on site.
Use this report to keep tabs on which channels are performing best for you. If you pour hours of time each day into Facebook for example but it is sending you only one or two visitors, you’ll need to look at what you could do better. Likewise, if your organic search figures are poor, it could mean that you need to ramp up your SEO efforts.
Keep an eye on these over time because changes to the data, such as figures being up or down, or higher bounce rates, signal that more optimisation could be required.
Behaviour > Site Content > All Pages
This report shows you how your visitors navigate around your site. For each page listed on the report, you can click through and Analytics will tell you exactly how they moved around your site to end up on that page.
This report is useful for picking out potential bottle necks in your content or navigation and will help you to identify whether or not you can simply the journey to key pages.
Audience > Mobile > Overview
Mobile first has become a mindset and mantra for web site developers and marketers over the last couple of years so it should come as no surprise to learn that the mobile report in Google Analytics is very handy. This particular report shows you what percentage of site visitors come from mobile devices and from desktop. You can also see bounce rates, time on page, conversation rate and even the type of device being used.
If you have high bounce rates from mobile visitors, you’ll need to address your site design and its overall user friendliness for mobile users. Use this report to hone in on opportunities to refine your mobile offering as this can help to generate more conversions and improve your rankings.


